Math (451)
Whether you're teaching basic arithmetic, algebra, geometry, or calculus, our comprehensive collection covers a wide range of topics and grade levels. From interactive games and worksheets to lesson plans and hands-on activities, our resources are designed to make math learning enjoyable and meaningful for learners of all abilities.
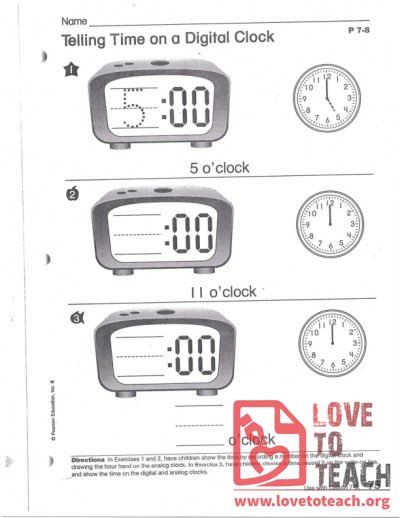
Have children show the time by recording a number on the digital clock and drawing the hour hand on the analog clock.
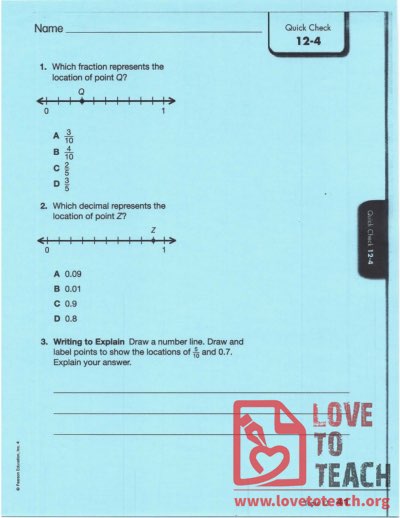
What fraction represents the location of point Q? What decimal represents the location of point P? Draw a number line...
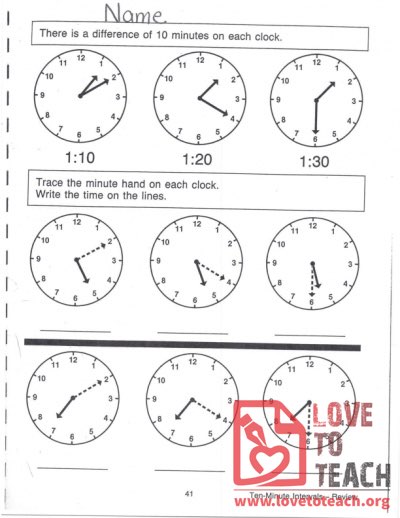
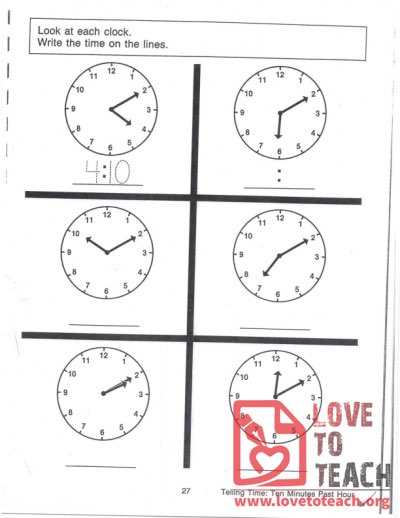
There is a difference of 10 minutes on each clock. Trace the minute hand on each clock. Write the time on the lines.
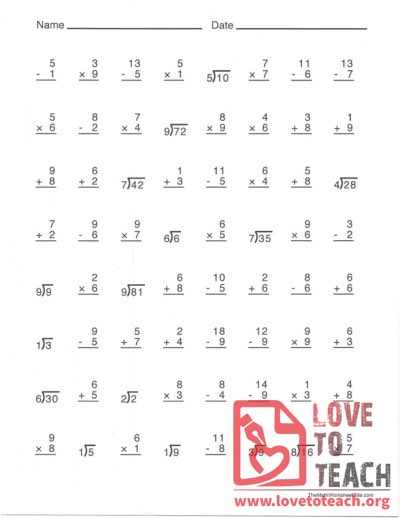
Free printable work sheet: 64 math problems, addition, multiplication, division, subtraction
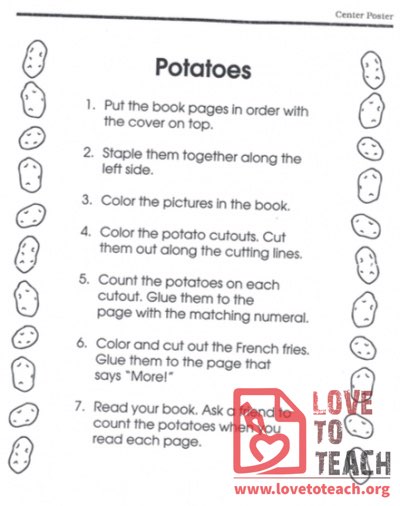
Using this coloring book, students can learn to count and match pictures to numbers with a catchy chant about potatoes.
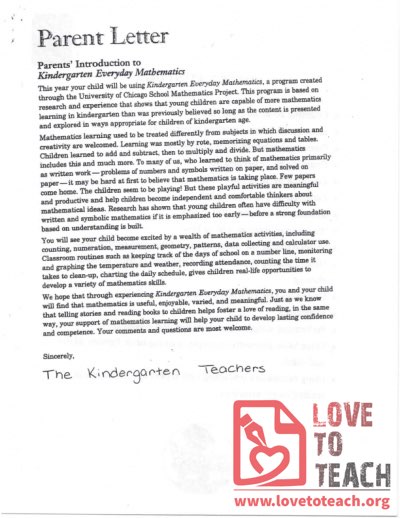
A general letter to parents on behalf of kindergarten teachers about Everyday Math
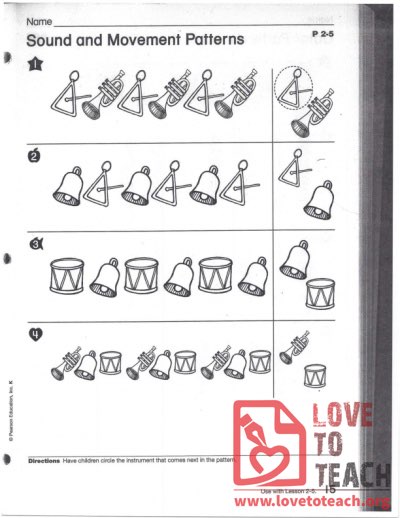
Have children circle the instrument that comes next in the pattern.
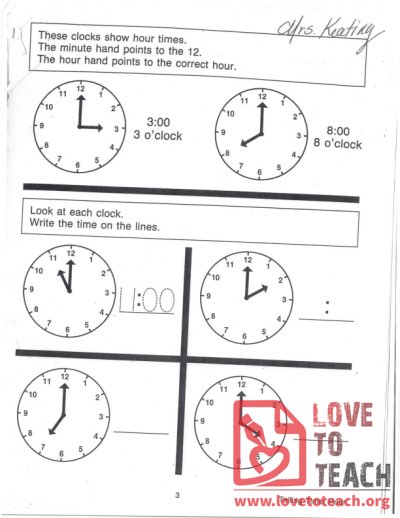
These clocks tell hour times. The minute hand points to the 12. The hour hand points to the correct hour.
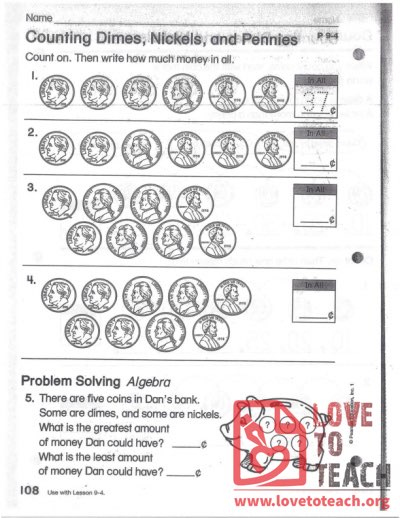
Count on. Then write how much money in all. Includes bonus algebra type question.
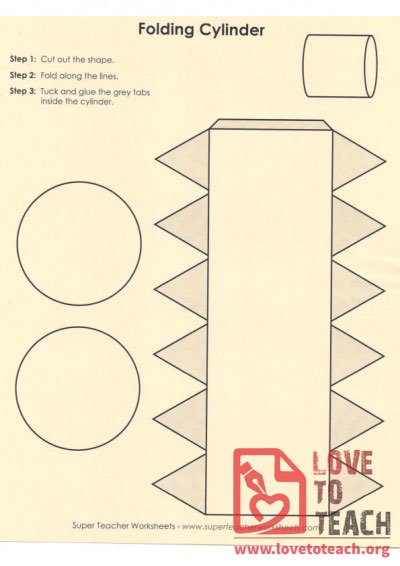
Includes all 6 folding worksheets: cylinder, cone, cube, pyramid, recangular prism, tetrahedron
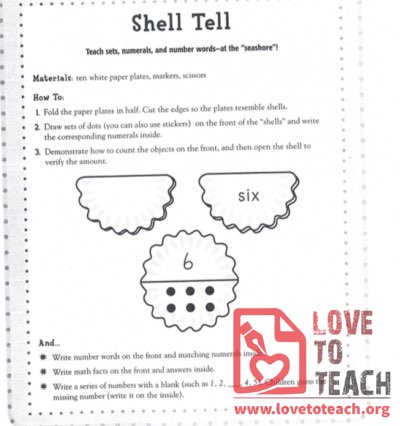
Folded plates that look like seashells are a great way to demonstrate the relationship between a number, its number word, and its value.
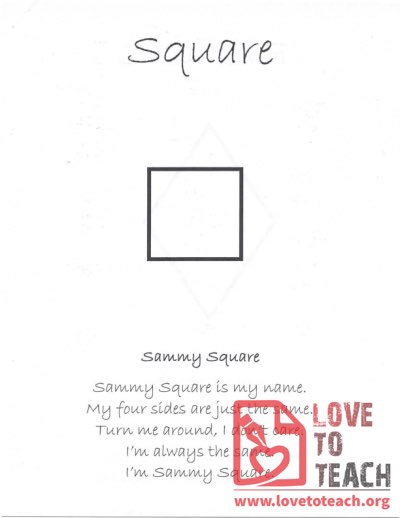
Sammy square is my name,My four sides are just the same.Turn me around, I don't care.I'm always the same.I'm Sammy Square.
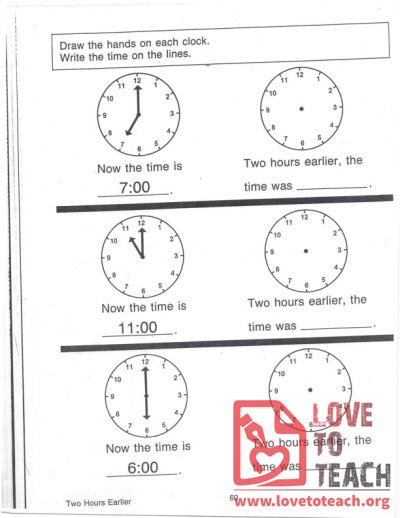
Now, the time is ____. Two hours earlier, the time was _____. Draw the hands on each clock. Write the time on the lines.
Clock practice worksheet: 10 minutes past the hour
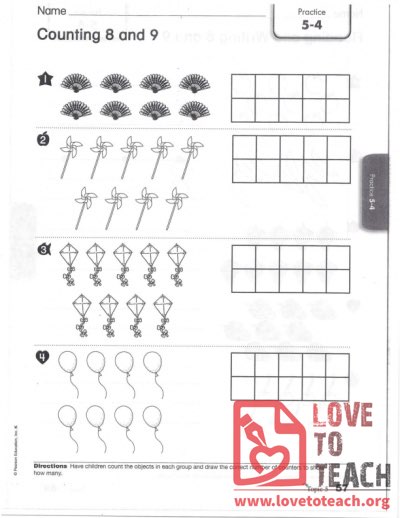
Worksheet for learning numbers 8 and 9: have children count the objects in each group and draw the correct number of counters to show how many.
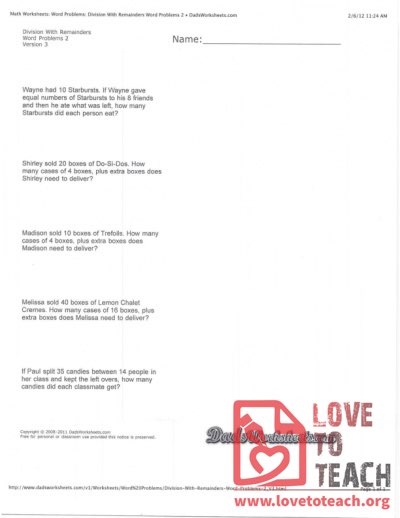
Math Worksheets: Word Problems: Division with remainders word problems
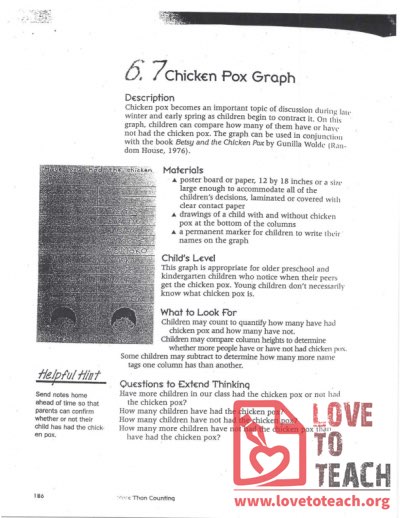
Chicken pox becomes an important topic of discussion during the late winter and early spring as children begin to contract it. On this graph, children can compare how many of them have or have not had the chicken pox. The graph can be used in conjunction with the book Betsy and the Chicken Pox by Gunilla Wolde.
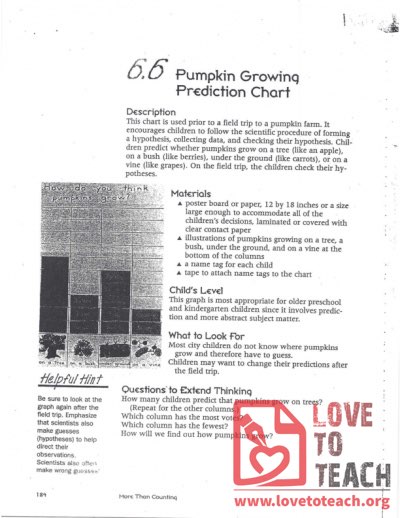
This chart is used prior to a field trip to a pumpkin farm. It encourages children to follow the scientific procedure of forming a hypothesis, collecting data, and checking their hypothesis.
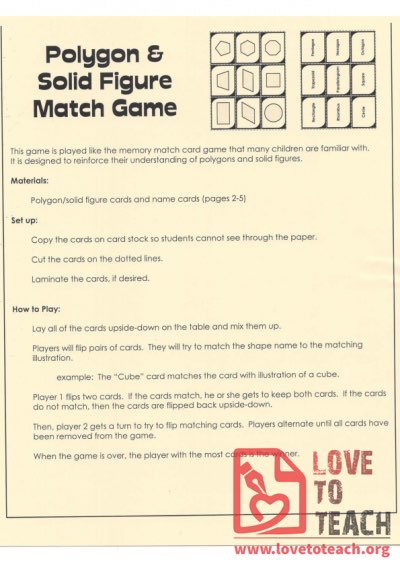
This game is played like the memory match card game that many children are familiar with. It is designed to reinforce their understanding of polygons and solid figures. 5 page packets, cards included!
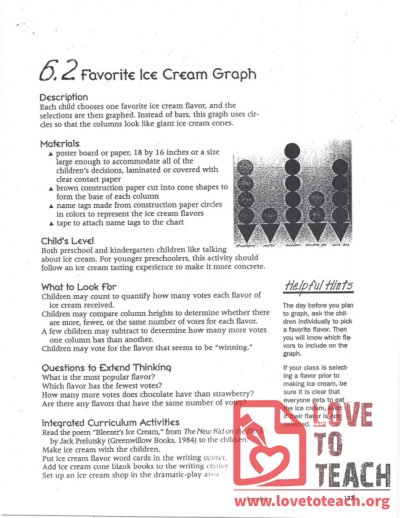
Each child chooses one favorite ice cream flavor, and the selections are then graphed. Instead of bars, this graph uses circles so that the columns look like giant ice cream cones.
Page 12 of 23
